We've been integrating the analytical and visualization environments in a web mapping application for the City of Santa Fe, oriented toward visual resource protection. We're working with the City to re-map their "Escarpment District" - a ridgeline and hillside protection zone. Our web mapping / GIS app provides a recipe to objectively and subjectively assess new construction impacts within the City and surrounding growth area.
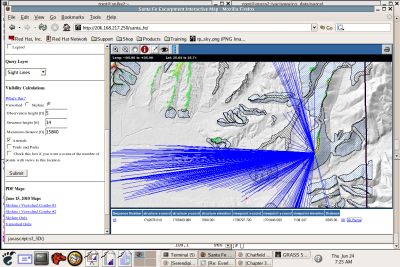
First, we choose a location on the landscape on which to site a structure. Next, we determine those (predetermined) observation points - in parks and along roadways - where the structure will break the skyline. The blue lines in the map below show sight lines to the structure.

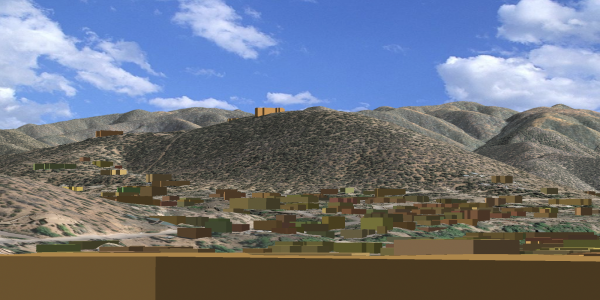
We can then choose any of the sight lines to generate a 3d rendering similar to the one at the top of this entry - all done in a server-side application with no plug-ins.


