Thursday, June 24. 2010
Visualizing Development Impacts
We've been integrating the analytical and visualization environments in a web mapping application for the City of Santa Fe, oriented toward visual resource protection. We're working with the City to re-map their "Escarpment District" - a ridgeline and hillside protection zone. Our web mapping / GIS app provides a recipe to objectively and subjectively assess new construction impacts within the City and surrounding growth area.
First, we choose a location on the landscape on which to site a structure. Next, we determine those (predetermined) observation points - in parks and along roadways - where the structure will break the skyline. The blue lines in the map below show sight lines to the structure.
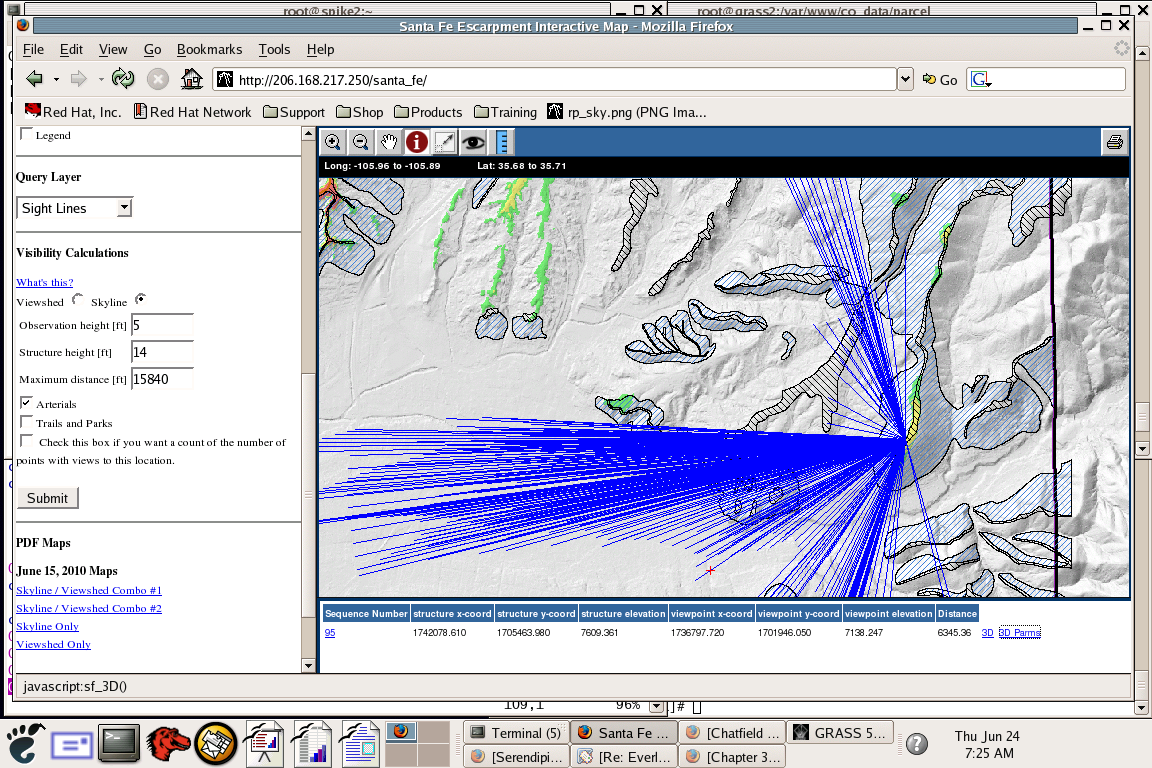
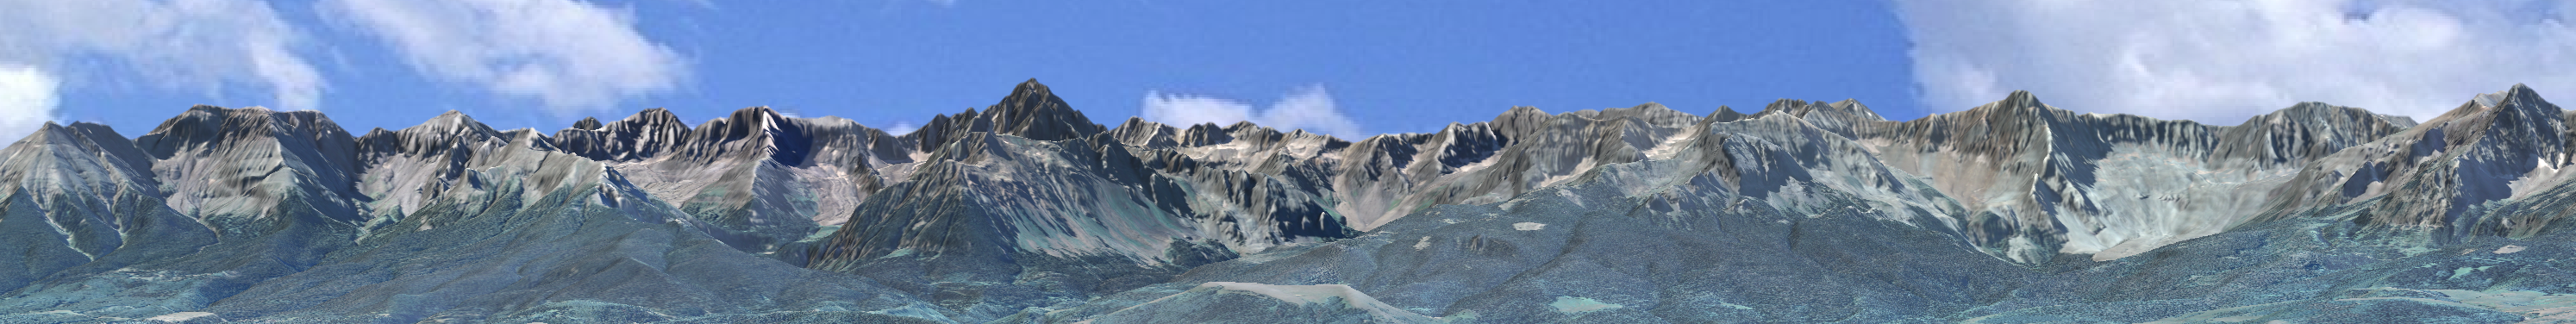
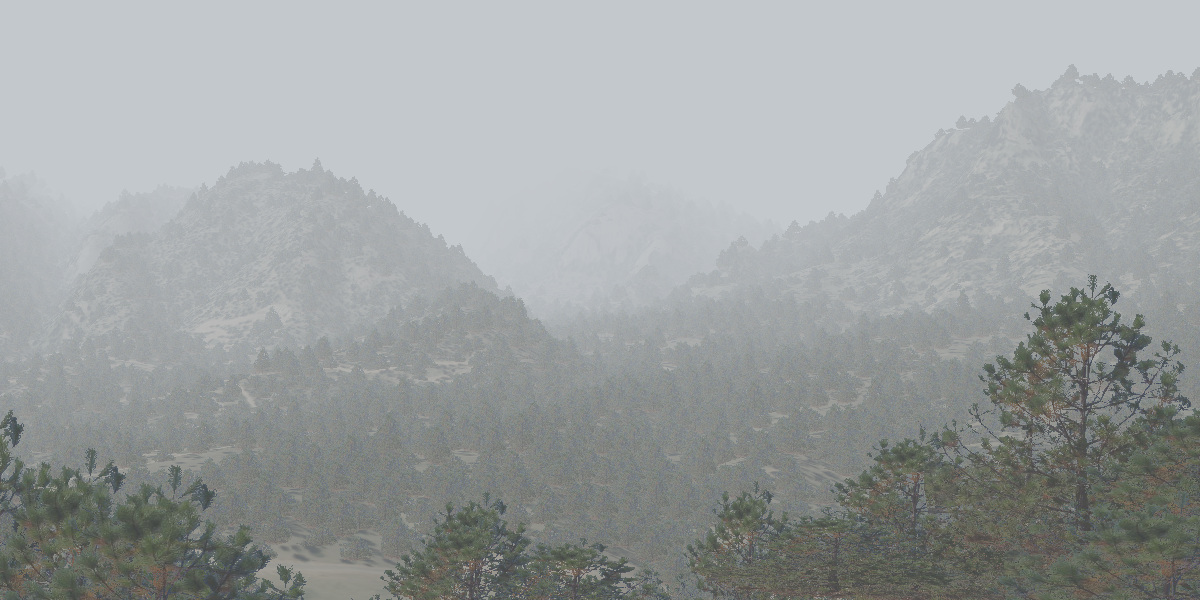
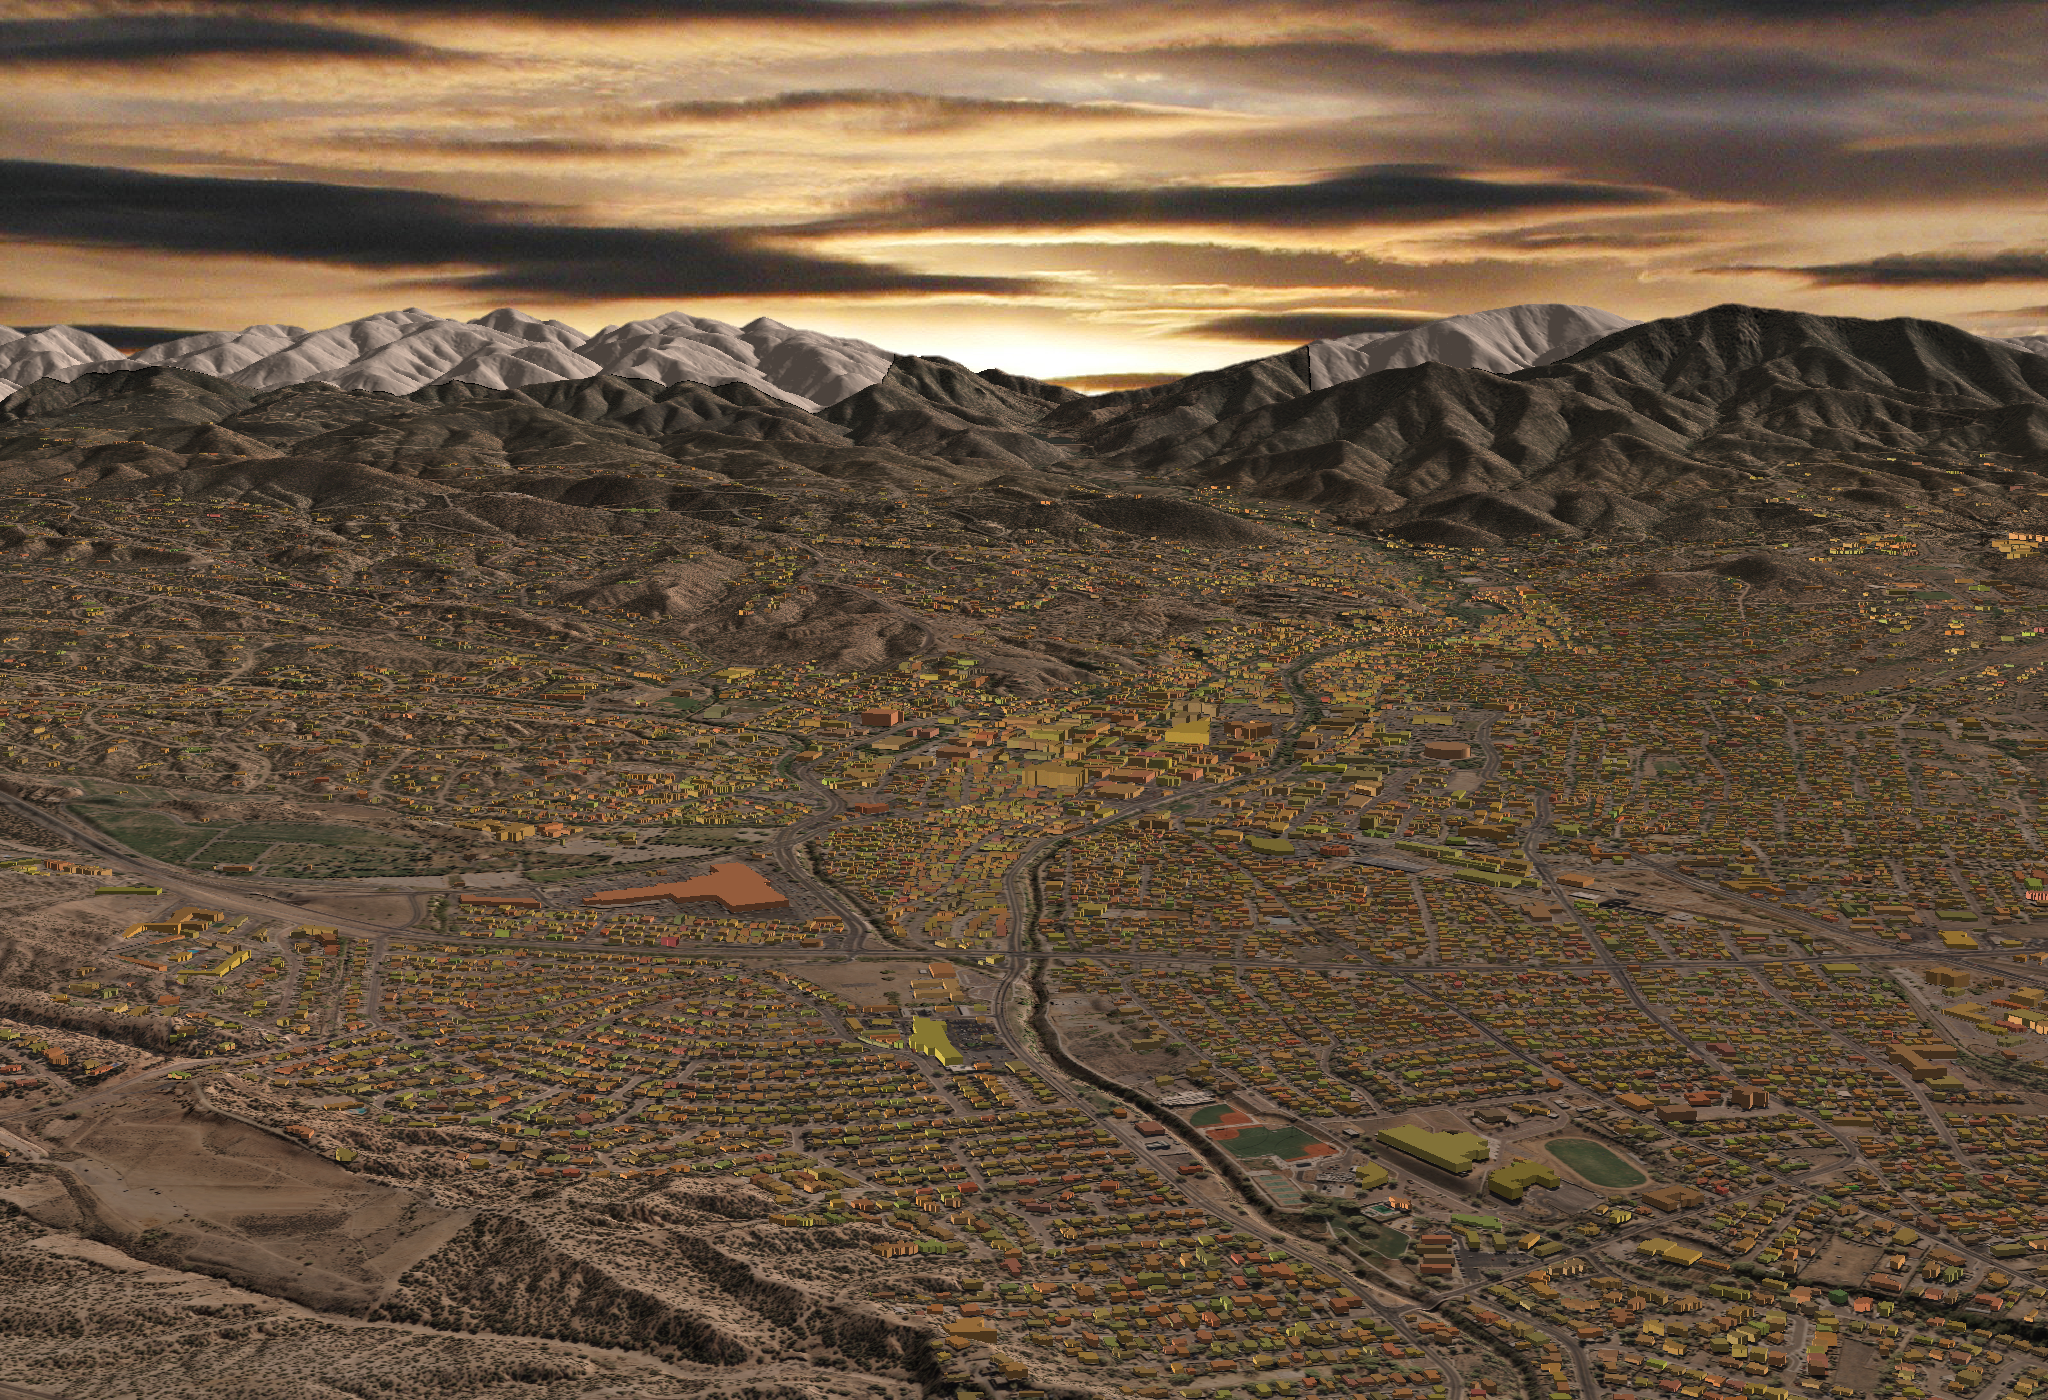
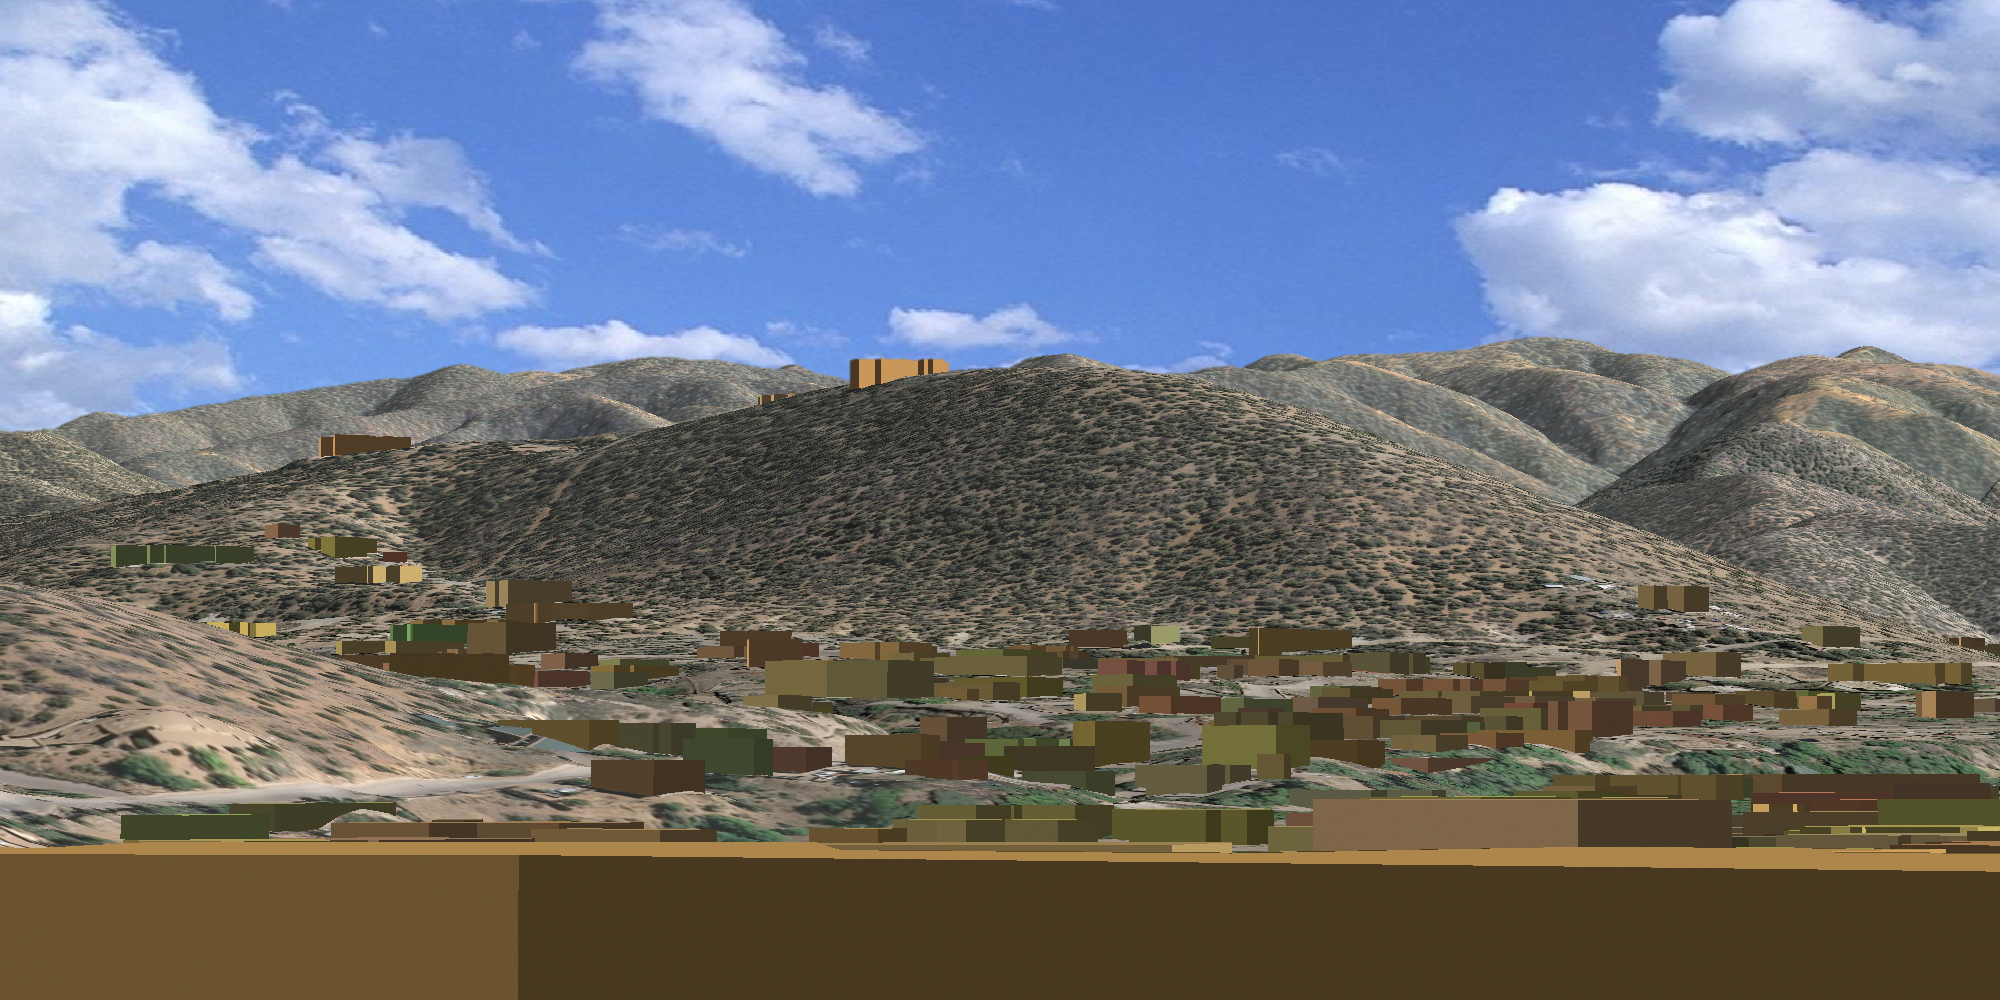
We can then choose any of the sight lines to generate a 3d rendering similar to the one at the top of this entry - all done in a server-side application with no plug-ins.
Tuesday, June 22. 2010
Fly The Plan!
We're so used to seeing plans in 2d, it's fun to see them come alive in 3d. Here's the fly-through segment (of the Preliminary Master Plan) from the Staunton "Solving the Master Planning Puzzle" video.
Friday, June 18. 2010
Longs Peak animation
Here's an animation of the Keyhole Route on Longs Peak (CO). We used 10m DEMs and 1m NAIP for the texture map.
Here's the direct link at vimeo:
http://www.vimeo.com/12306850
Panoramas
Thursday, June 17. 2010
Staunton Master Plan
Solving the Staunton State Park Master Planning Puzzle - a video we produced as part of the Master Planning process for the Park.
Fog at Staunton State Park
Santa Fe Sunrise
This "high over Santa Fe" image shows off a number of data layers from the City's GIS Department. The DEM was generated from LiDAR data; 6-in resolution orthophotos were used for the texture map; and digitized building footprints were extruded based on the building height field.Here's the full res image.
(Page 1 of 1, totaling 7 entries)