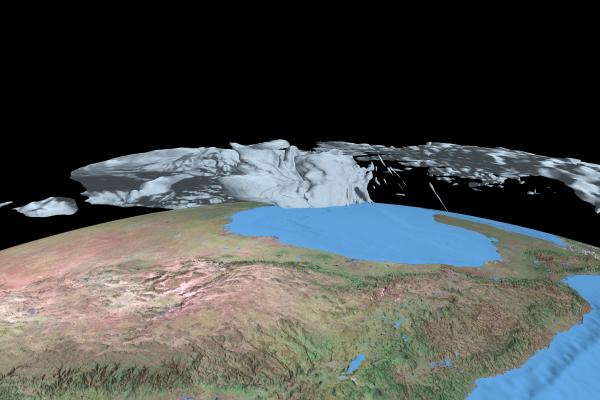
Another volume modeling visualization area of application is analyzing atmospheric data. A few years back we animated some model data representing the devastating Hurricane Katrina. Here's a frame from that animation that I've regenerated at higher resolution:

(Click image for high resolution version.)
Model data is courtesy of Jian-Wen Bao of the National Oceanic and Atmospheric Administration (NOAA). The gray atmospheric "body" shows the 25 m/s isosurface generated from model output for a time slice on Aug 29, 2005. The core of the high wind area engulfs New Orleans, LA, with the well-known tragic results. You can view a small-sized version of the animation in the "Volume Modeling" section of our animations page.


