Pikes Peak is the monarch overlooking the City of Colorado Springs. It's a tremendous tourist draw. Although you can drive to the top, the 13-mile Barr Trail is the longest of any Colorado 14er. In addition, it's got fantastic technical rock climbing on numerous alpine crags.
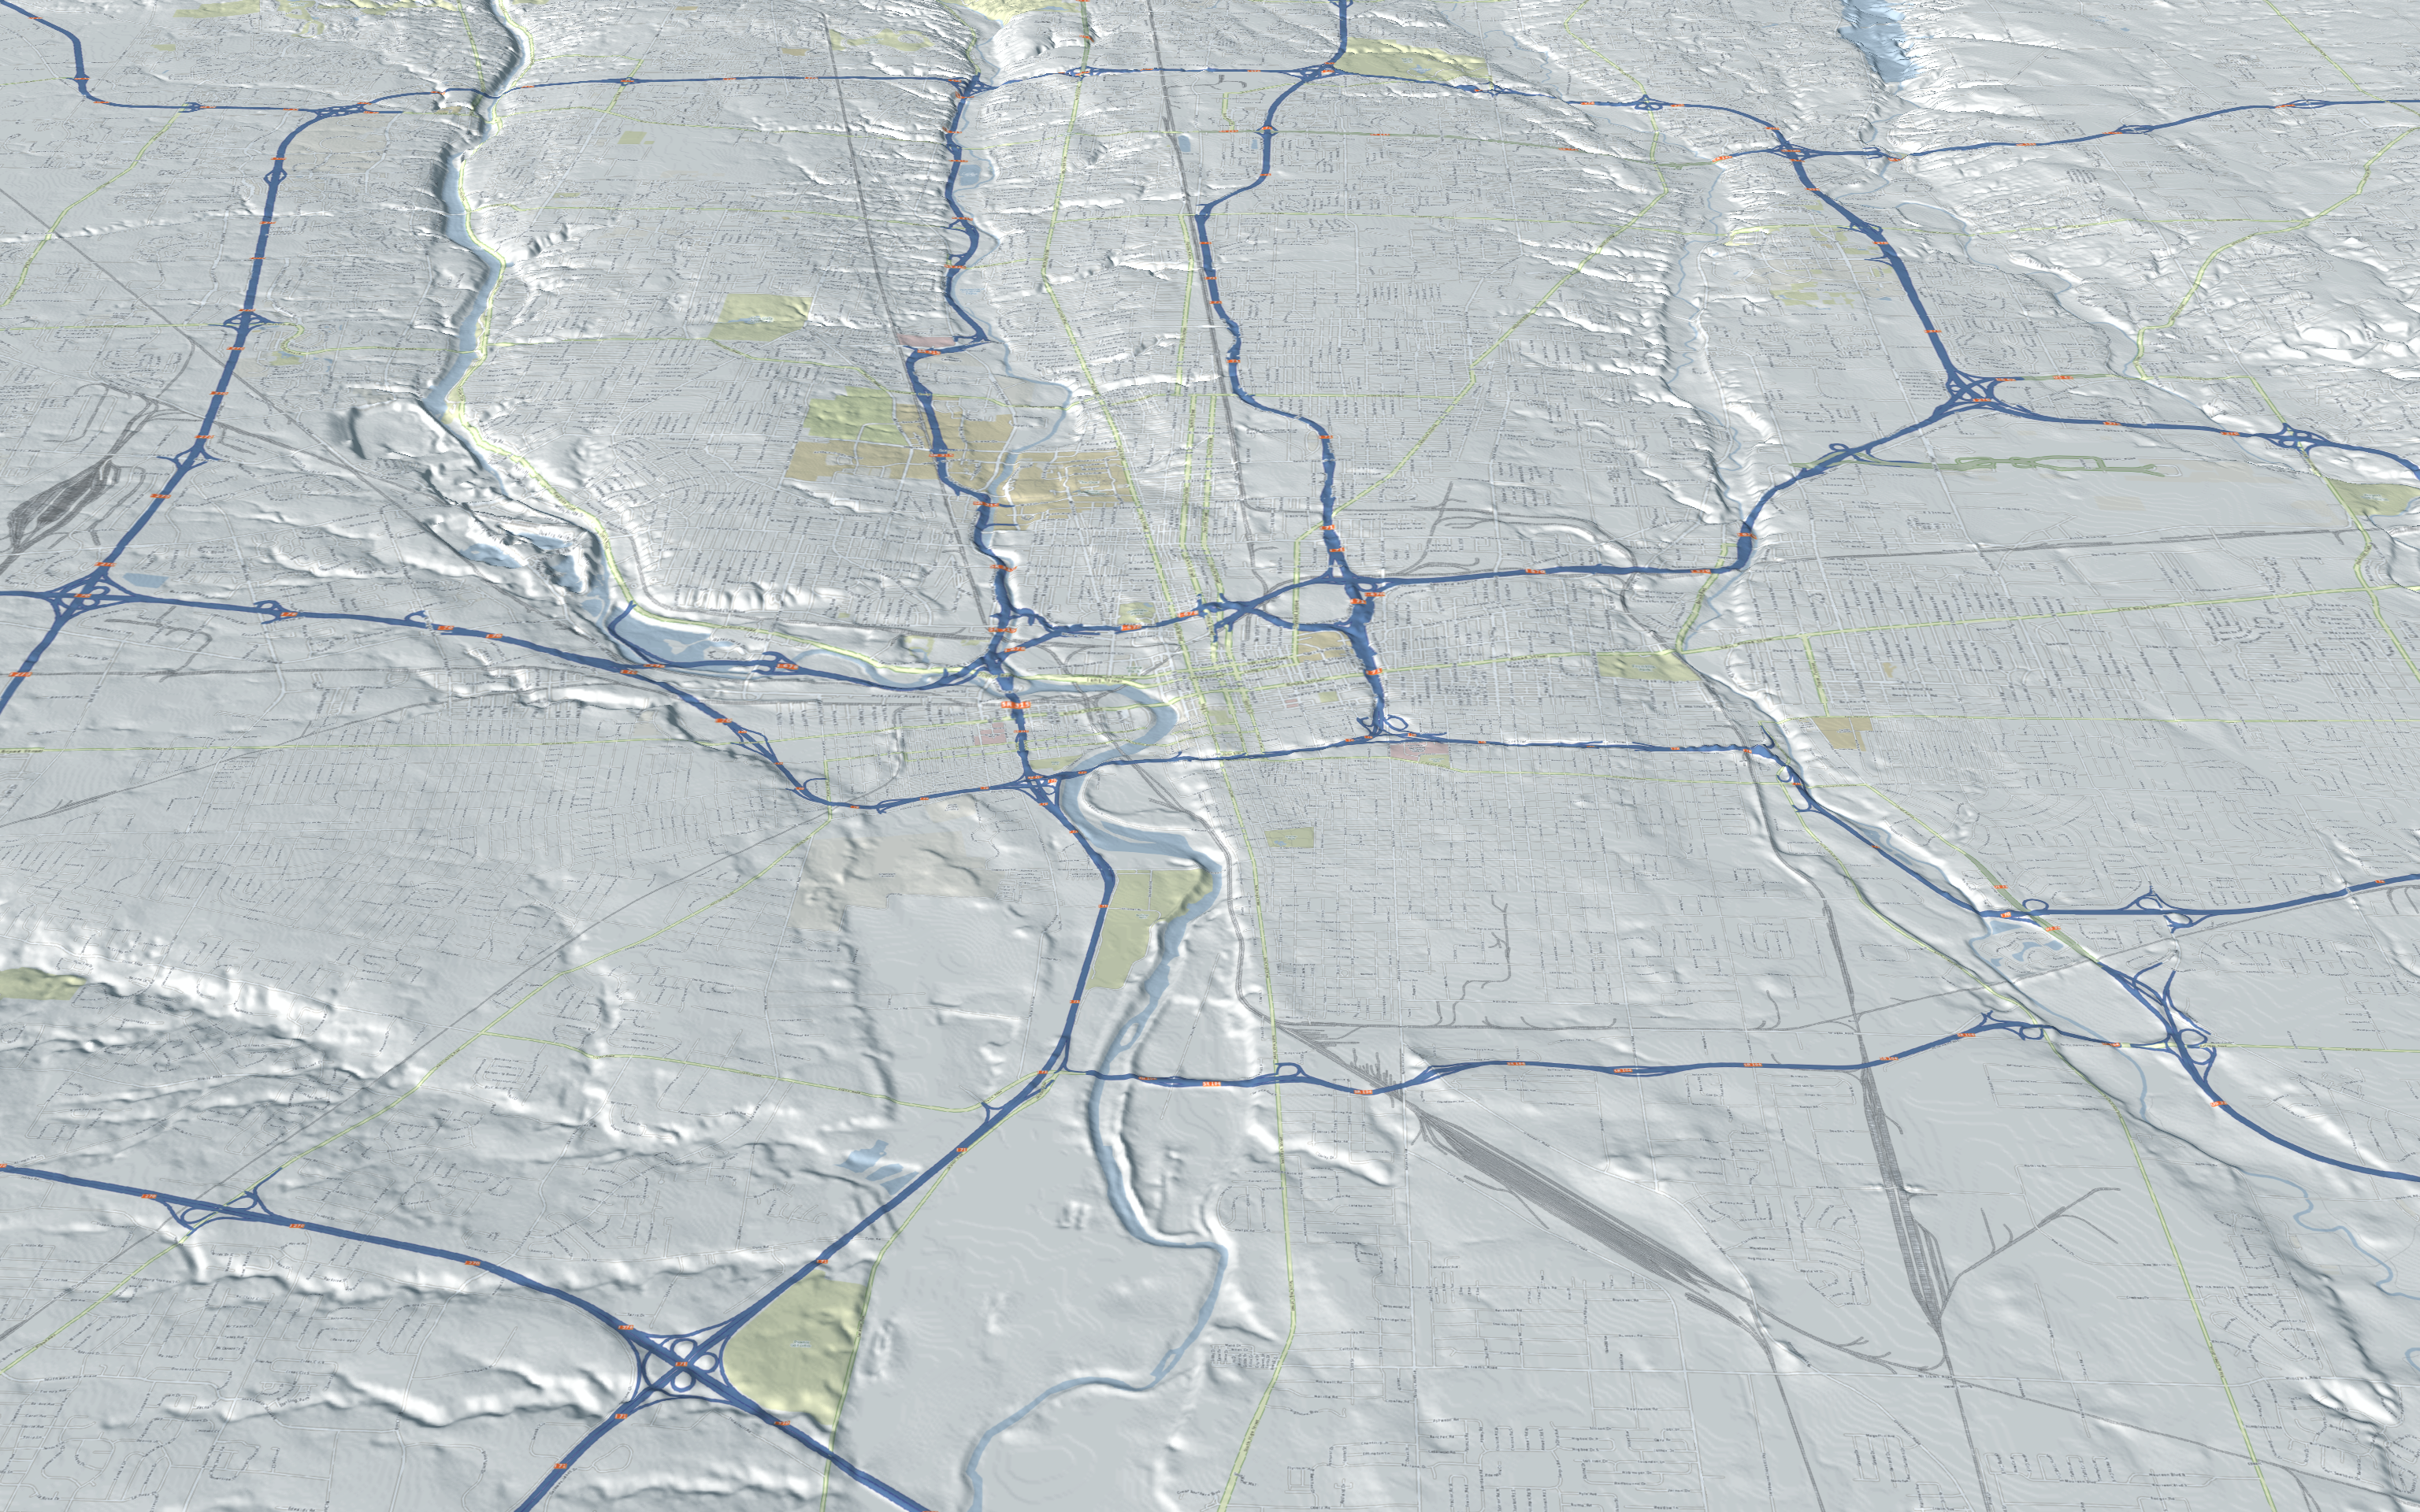
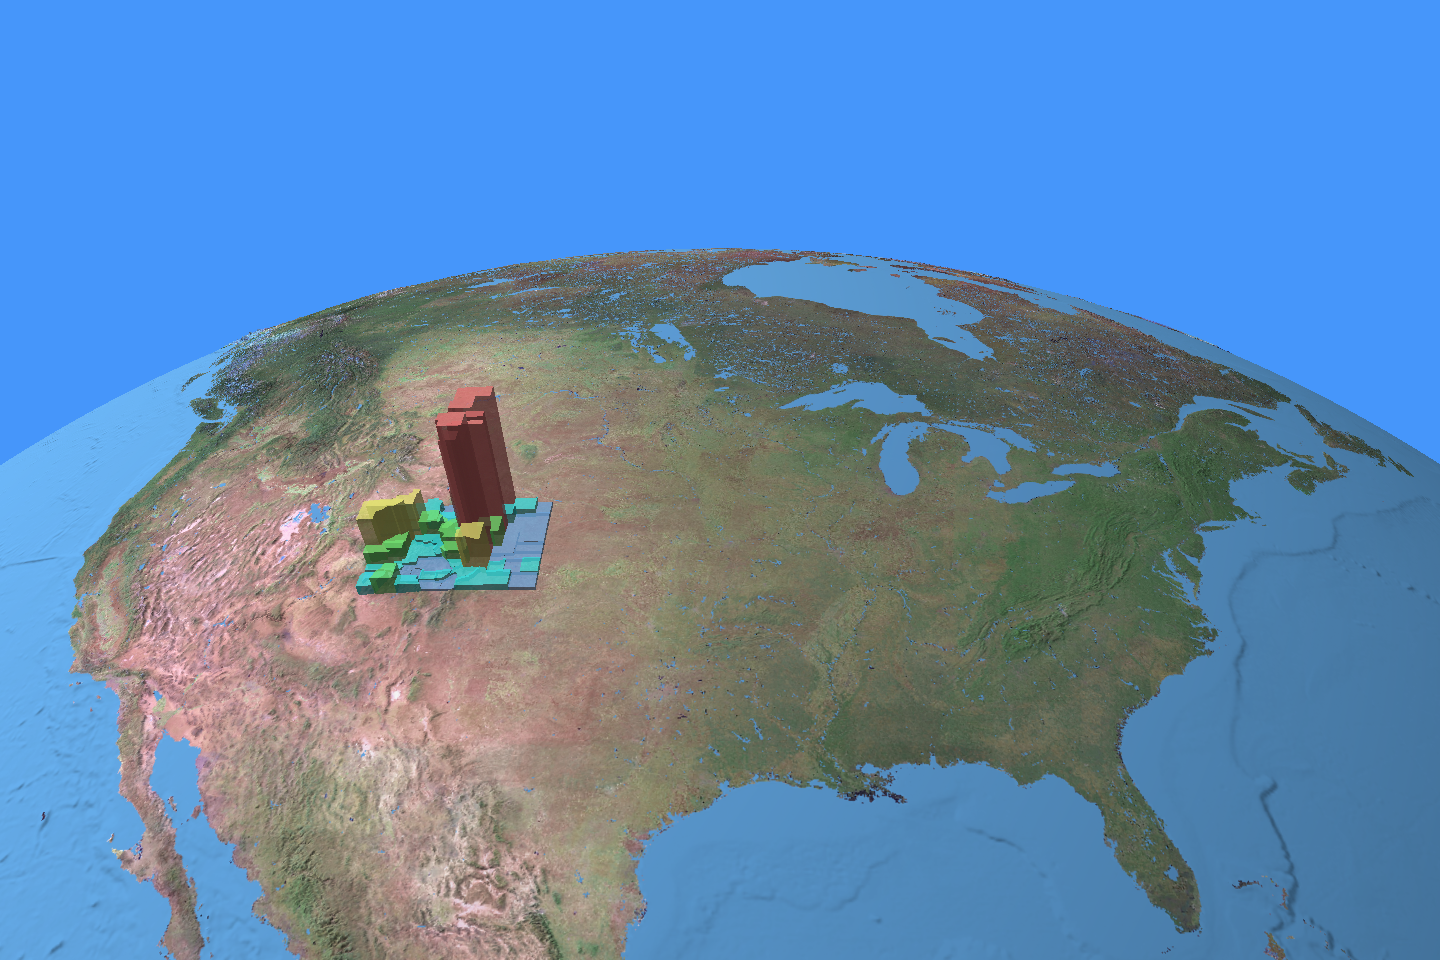
Here's a rendering of Pikes Peak high over Colorado Springs (click for the high res version):
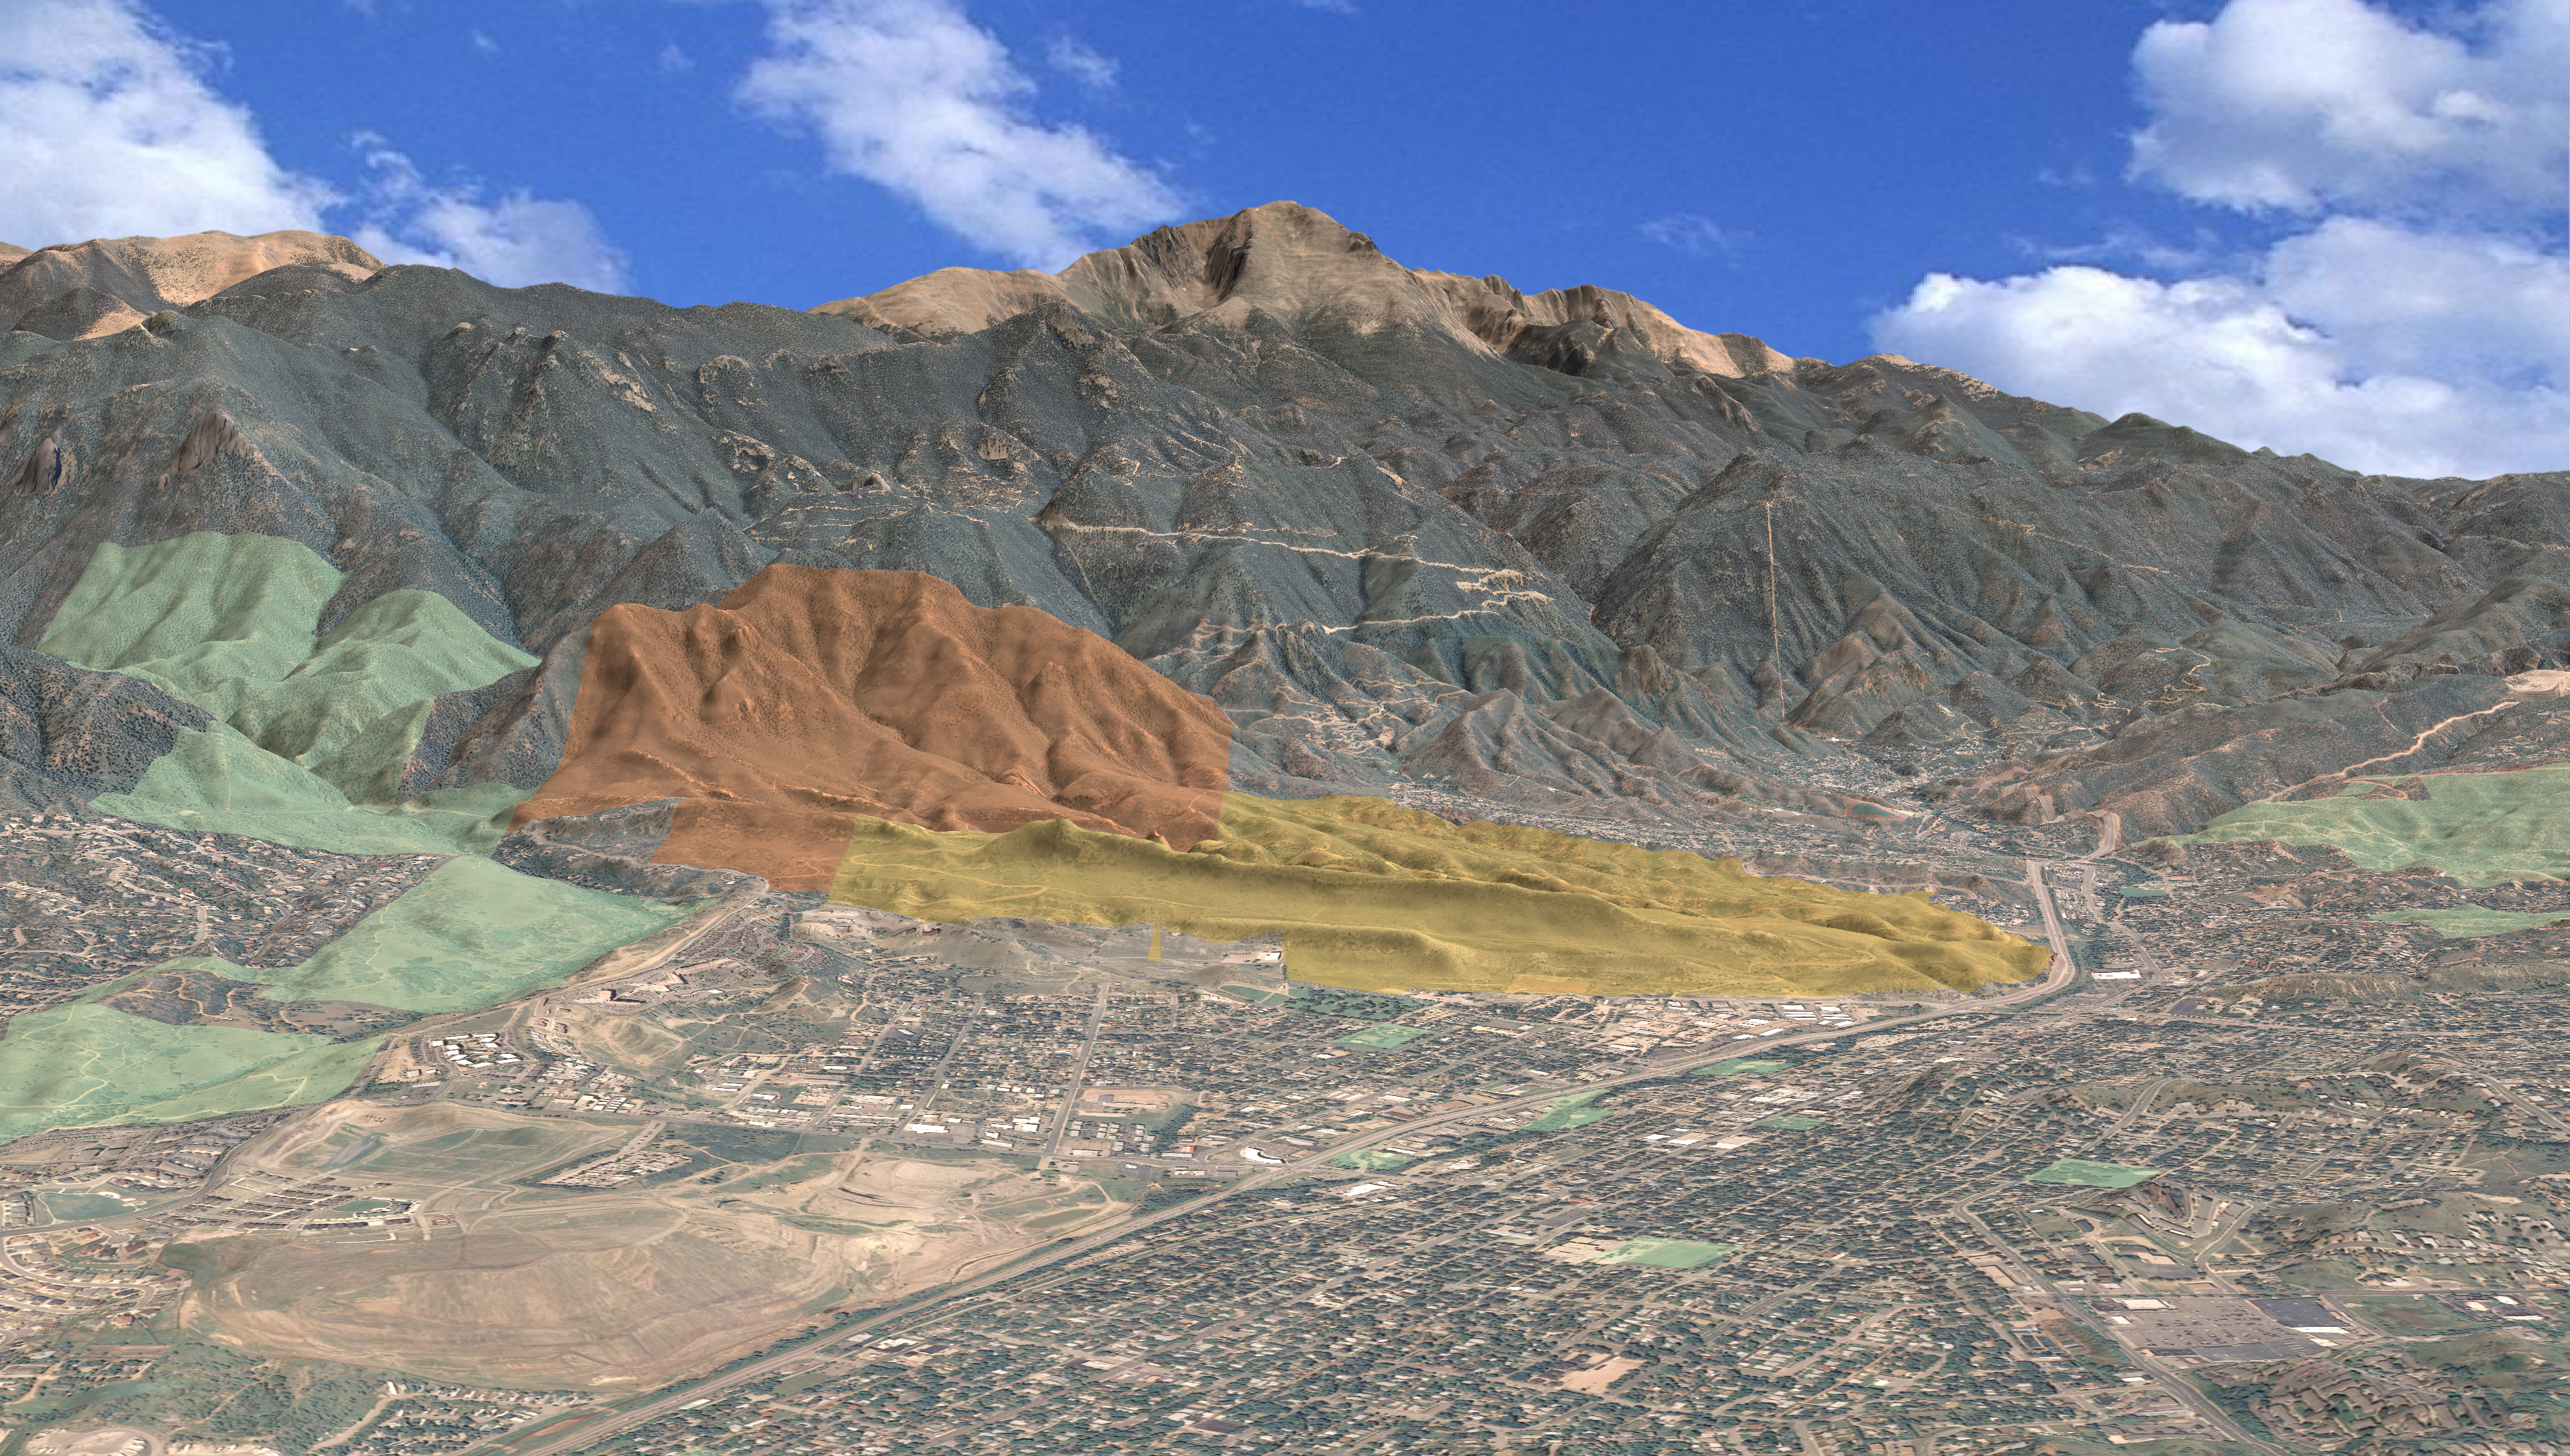
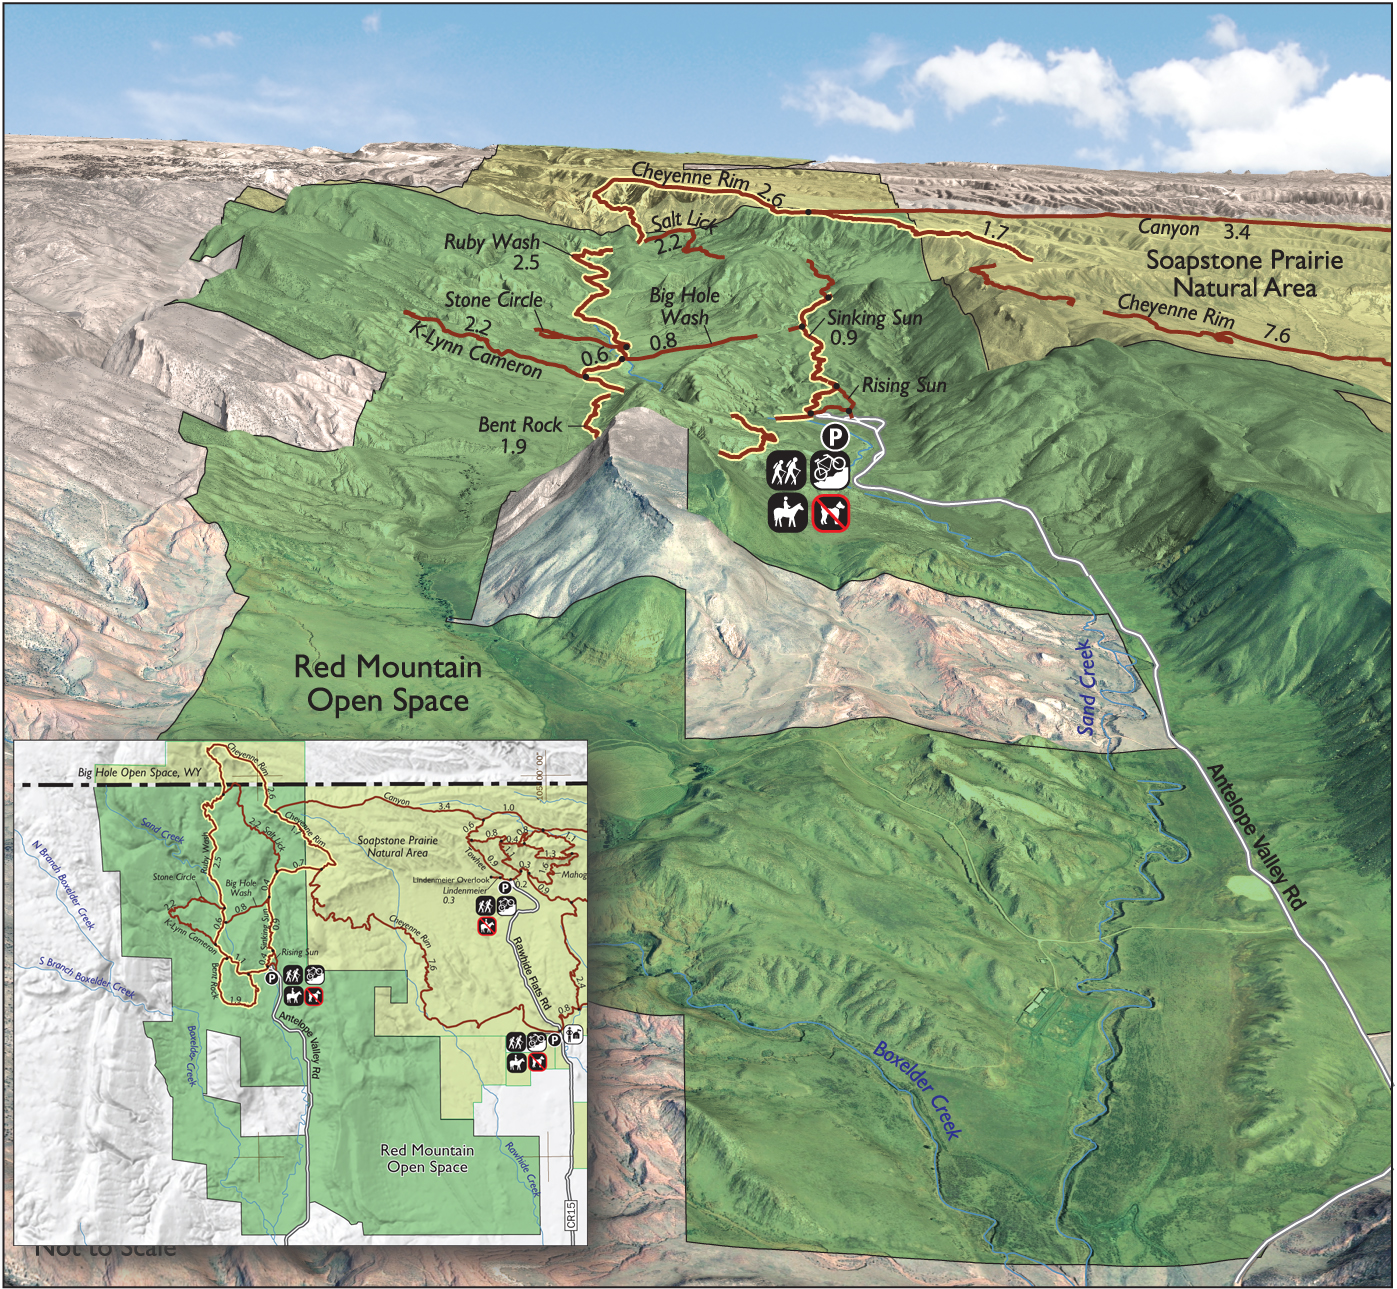
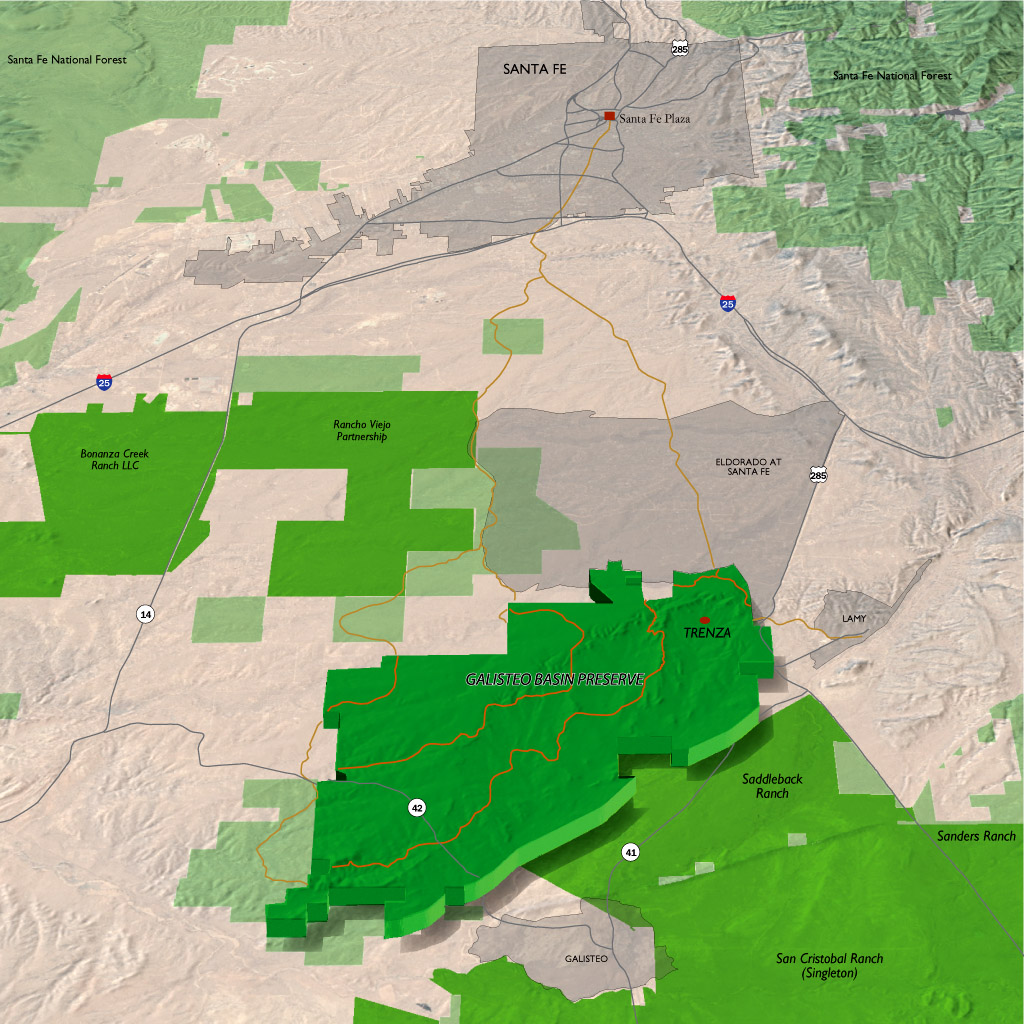
We're on a team that's submitted a proposal for a master plan for the open space properties that are shown in orange and yellow. The yellow colored property - Red Rock Canyon - is already open and a popular destination for visitors and residents. The orange properties - White Acres and Manitou Section 16 - have just been acquired and will add 700 or so acres to the north.
Tuesday, March 29. 2011
Chaining Web Services
In a previous post I alluded to using OSM as a texture map in a perspective rendering. I created the tiles through a mapserver-based WMS serving up the OSM data through postgresql.
Years ago I wrote an "elevation server" that - among other things - generates hillshade with elevation colors based on custom color lookup tables. I've been playing around chaining these two services to produce distinctive looking images. Here are a few examples.
The "desert" motif (click on image for high res version):
The "winter" motif (click on image for high res version):
...And something for people who like really saturated colors (click on image for high res version):
The elevation server has great potential for generating custom tiles for web mapping apps and very high resolution images for cartographic projects. In the coming weeks, we'll roll this service out to those who are interested - so stay in touch!
Wednesday, March 16. 2011
Prezi Presentation on GIS for Real Estate Development
A month or so ago I presented to graduate students in the CU Leeds School of Business on the potential uses of GIS in Real Estate Development. The idea was to help the students understand the basics of GIS and to get them using Google Earth a basic GIS. The students were great, they picked up on the concepts and the application of GIS to Real Estate Development very quickly. Some of the students were able to download and open up data in Quantum GIS within the one hour allotted for the presentation.
I used Prezi to create this presentation. It was my first go at it, and I was fairly happy with the results. I am not sure how the class felt about it, but I felt like the presentation flowed more naturally than it did when I have used PowerPoint. The presentation can be found below.
Friday, March 11. 2011
2D vs 3D maps
I have been working on a map of the Red Mountain Open Space in Larimer County (see below). It connects to an open space in Wyoming called the Big Hole Open Space. Though hill shading is a very effective tool to illustrate underling terrain, until we moved the map into 3D space, I completely missed the dramatic geologic "hole" that the area encompasses!
(Click on image for high res version)
Monday, February 28. 2011
OpenStreetMap - 3d View
I've been playing around with Open Streetmap (OSM) lately for a couple of web mapping projects. While the import to postgresql was a bit challenging, the results are great!
Here's an example (click for high res version):
I generated tiles from a mapserver-based WMS that accessed the pgsql data. I'll need to play around a bit with scale to make the text readable in the 3d rendering.
Here's an example (click for high res version):
I generated tiles from a mapserver-based WMS that accessed the pgsql data. I'll need to play around a bit with scale to make the text readable in the 3d rendering.
Friday, February 18. 2011
Emphasizing Points
In previous posts we've discussed emphasizing ridgelines, linework, and property boundaries.
Suppose you want to emphasize a point set. Here's a fun way by converting the points into spheres (click for high res version):
The points are raised above ground based on an attribute value. A couple of tricks help them stand out. For one, there's a nice specular reflection to help define it as a 3d object. Also, the spheres cast a shadow that helps highlight their position above ground level.
Here's a close up view (click for high res version):
Wednesday, February 2. 2011
Terrain Morph
We work in a lot of areas with substantial topographic relief. Topography is often the most compelling characteristic of an area and I've found a nice way to emphasize this fact. Instead of looking at a "flat" map or 3d view, what about transitioning between the two? Here's a clip from a video that we're currently working on for Colorado's Staunton State Park:
It's a slick way of focusing your attention on how mountainous the area really is.
Friday, January 21. 2011
Prairie Falcon
Here's a visitor that we had a week or so ago - a female Prairie Falcon.
(All images courtesy of Cat Russell, Spike Productions.)
...and here's the Prairie Falcon range map (adapted from this site).
Like the Northern Goshawk, the Prairie Falcon predominantly hunts birds. It was was likely attracted by the large number of pigeons that we have hanging around.
(All images courtesy of Cat Russell, Spike Productions.)
...and here's the Prairie Falcon range map (adapted from this site).
Like the Northern Goshawk, the Prairie Falcon predominantly hunts birds. It was was likely attracted by the large number of pigeons that we have hanging around.
Thursday, January 6. 2011
3D trail maps
The National Park Service did a study to evaluate(~6.8 megs) the effectiveness of 2D hiking maps compared to 3D hiking maps for communicating trail information. One finding was that in general, 3D maps enabled hikers to more accurately identify their position on the landscape compared to 2D maps. We've produced a both 2D & 3D maps for Larimer County's Natural Resource Recreation map, but the Horsetooth Mountain Park is one of my favorites.
Thursday, December 23. 2010
Making your property pop
Friday, December 10. 2010
The Many Faces of Image Texturing
Tuesday, December 7. 2010
Thematic Data Visualization
Here's an alternative to creating a raster "pseudo-elevation" data set of values for thematic data visualization: keep your polygons in vector and extrude based on the thematic value. This gives good color control - particularly on the sides of the extruded polygons - and lets you combine these with a real elevation data set (click for high res version):
The image above illustrates absolute population growth for Colorado counties between 1990 and 2000.
An additional advantage of this technique: you can make your polygons transparent (click for high res version):
...and you can easily change views without adding more thematic data:
The image above illustrates absolute population growth for Colorado counties between 1990 and 2000.
An additional advantage of this technique: you can make your polygons transparent (click for high res version):
...and you can easily change views without adding more thematic data:
Wednesday, December 1. 2010
Why the Earth is round
Tuesday, November 23. 2010
Northern Goshawk
A couple of weeks ago we had an unusual visitor - a Northern Goshawk. The Northern Goshawk is the largest North American raptor in the Accipiter genus. Accipiters usually hunt other birds, but this one - a female - killed a rabbit near our house. Here's a picture (courtesy of Cat Russell from Spike Productions):
Looking at their range, it becomes clear where the "Northern" part of the name comes from. The map below is adapted from one I found on a US Fish and Wildlife site.
We typically see the Accipiters during Fall and Spring, when they're migrating.
Looking at their range, it becomes clear where the "Northern" part of the name comes from. The map below is adapted from one I found on a US Fish and Wildlife site.
We typically see the Accipiters during Fall and Spring, when they're migrating.
Friday, November 19. 2010
Impending Storm ... or Clearing Skies?
I've been messing around with lighting and attenuation as a simple way to provide the feel of different weather conditions.
Here's the impending storm (click on image for larger version):
and the clearing skies (again, click for high res version):
Same view, imagery, etc - just different lighting and attenuation.
Here's the impending storm (click on image for larger version):
and the clearing skies (again, click for high res version):
Same view, imagery, etc - just different lighting and attenuation.
« previous page
(Page 3 of 5, totaling 69 entries)
next page »