Friday, July 9. 2010
Lines on the Landscape
Friday, July 2. 2010
Obstruction Grids

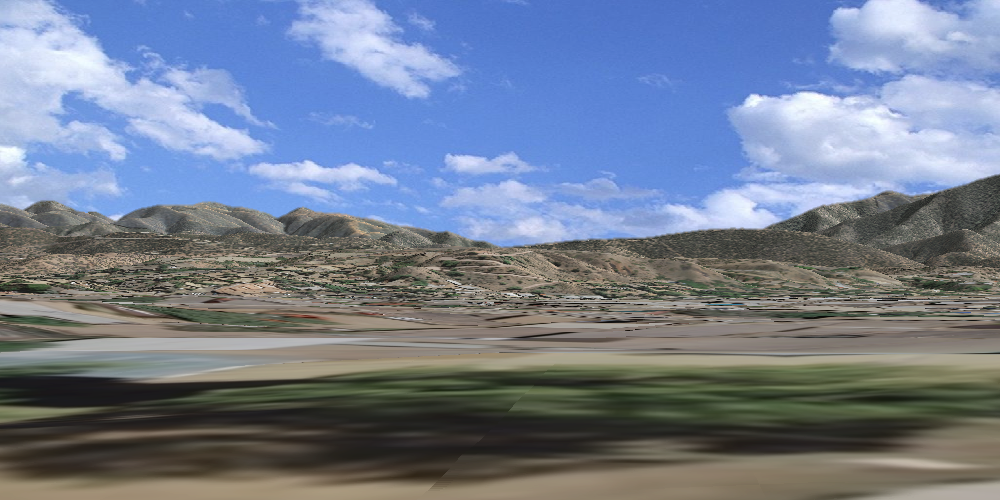
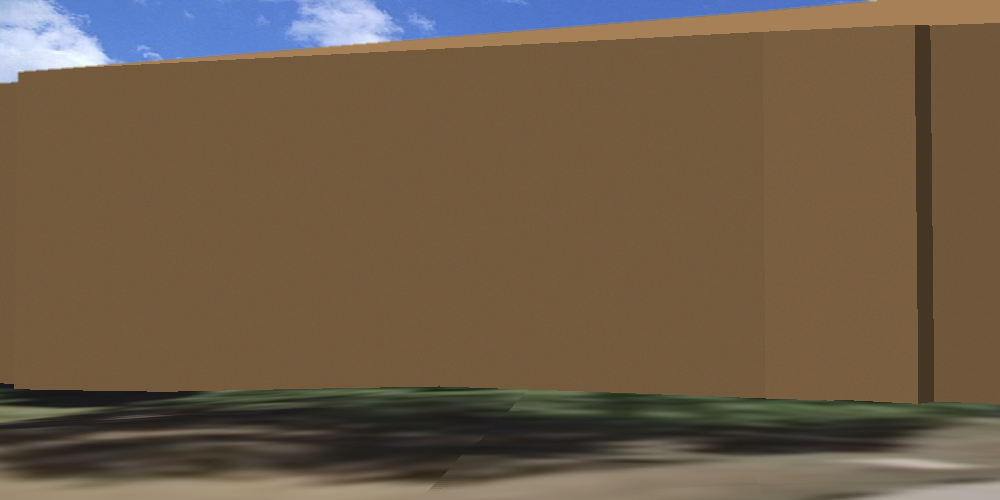
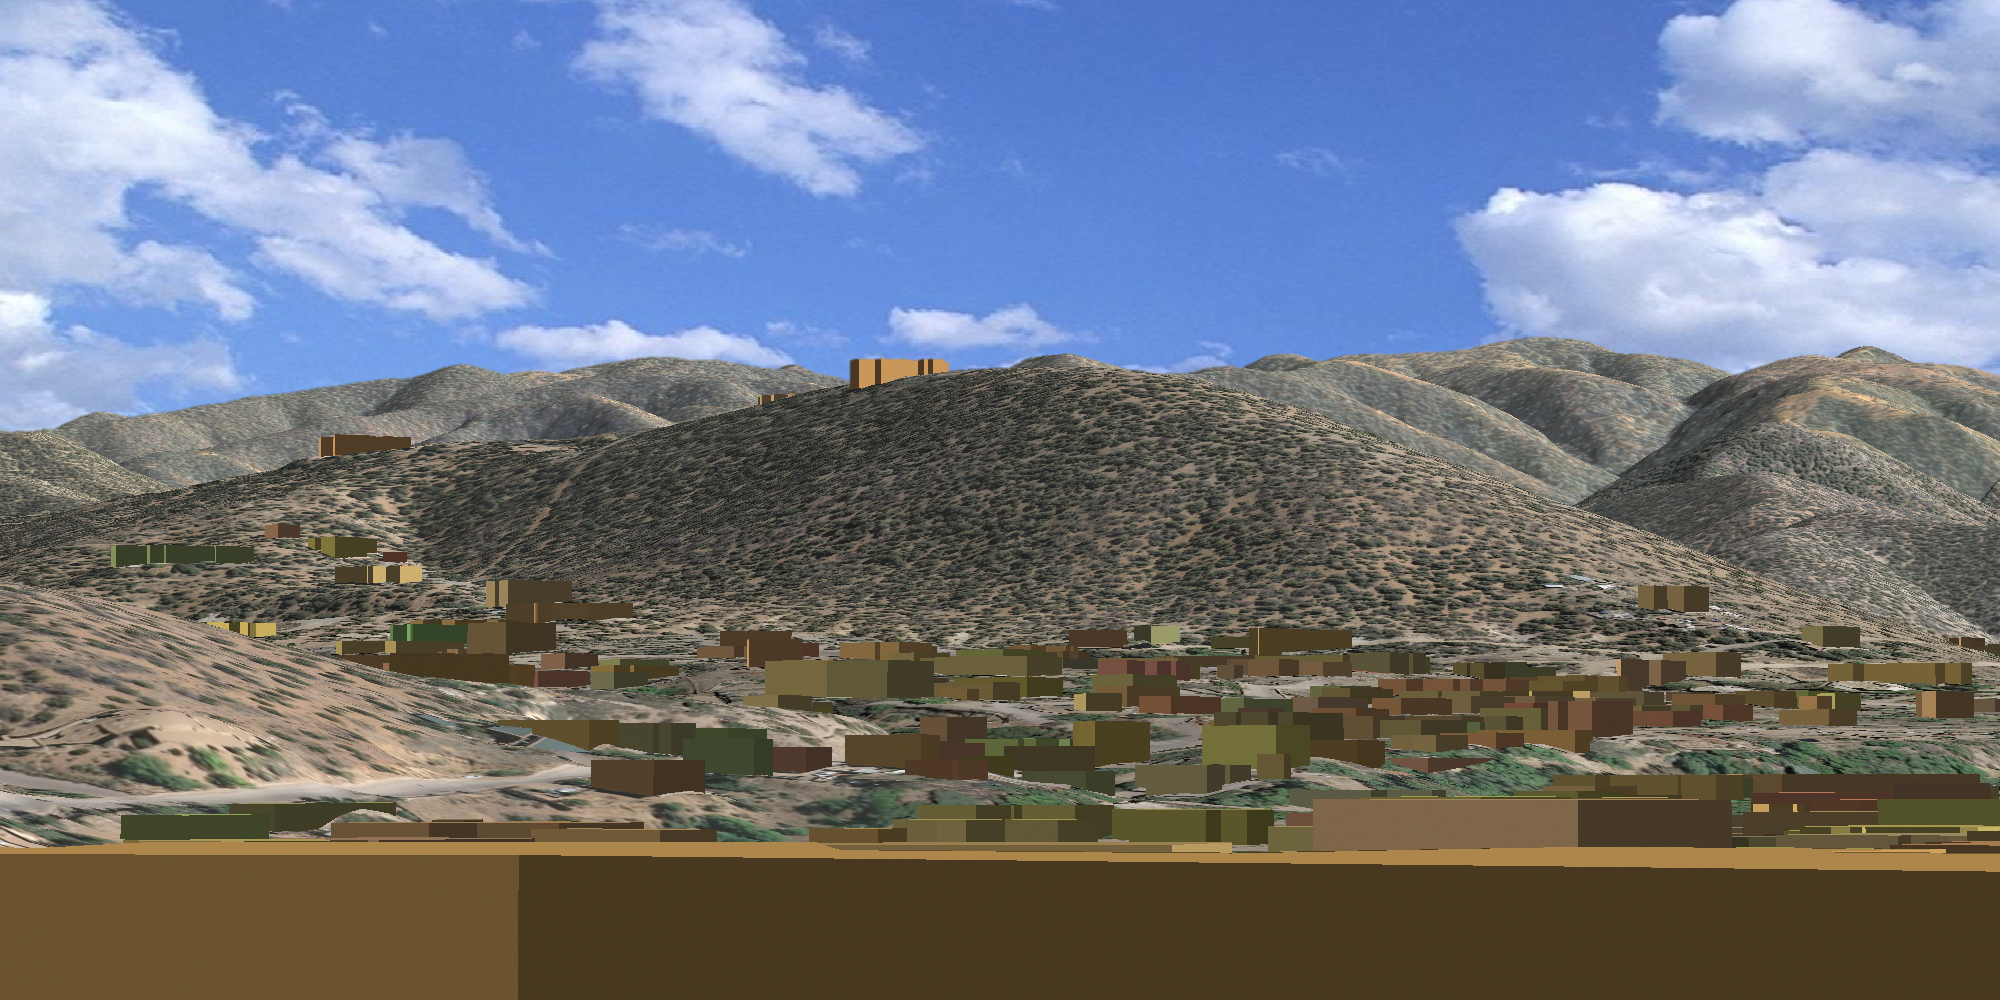
Obstructions, such as trees and buildings, create a major challenge in modeling landscape visibility. In arid, rural regions with little tree cover, terrain only modeling makes a lot of sense and certainly simplifies the visual analysis process. Once in urban areas or areas with significant tree cover, it's a completely different game. In the image set above, the top image excludes trees; the bottom image includes trees that were surveyed, with estimated heights and widths. There's obviously a huge visibility - and quality of view - difference between the two.
The images above - same point, the 1st doesn't include buildings, the 2nd does.
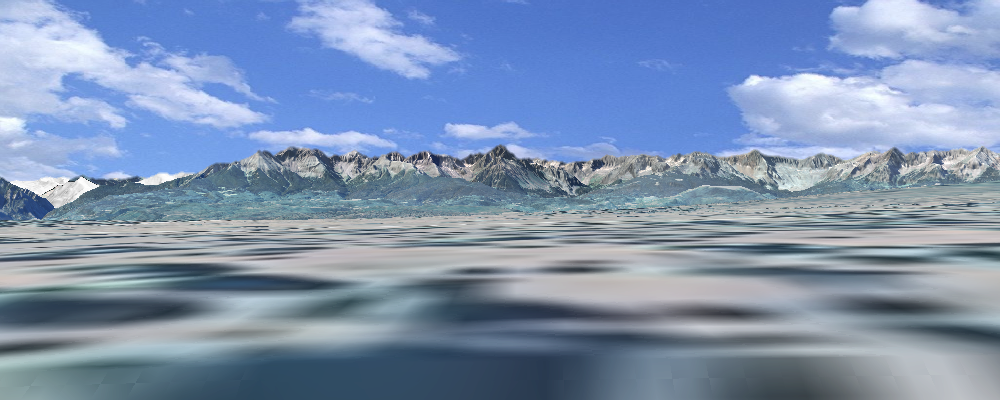
The image pair below show viewshed results for a forested area in Montana. We've left out trees in the top image and included them in the bottom...
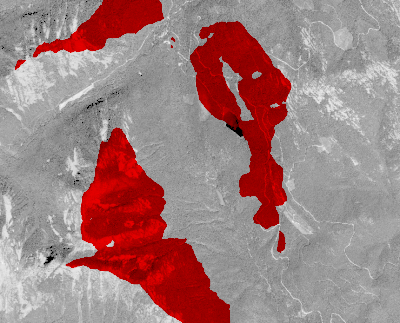
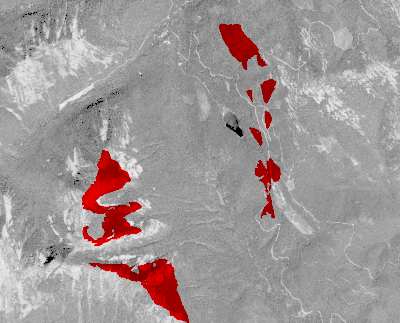
...big differences in the size of the viewshed. Building the obstruction grid creates another set of problems and will be discussed in a later post.
Thursday, June 24. 2010
Visualizing Development Impacts
We've been integrating the analytical and visualization environments in a web mapping application for the City of Santa Fe, oriented toward visual resource protection. We're working with the City to re-map their "Escarpment District" - a ridgeline and hillside protection zone. Our web mapping / GIS app provides a recipe to objectively and subjectively assess new construction impacts within the City and surrounding growth area.
First, we choose a location on the landscape on which to site a structure. Next, we determine those (predetermined) observation points - in parks and along roadways - where the structure will break the skyline. The blue lines in the map below show sight lines to the structure.
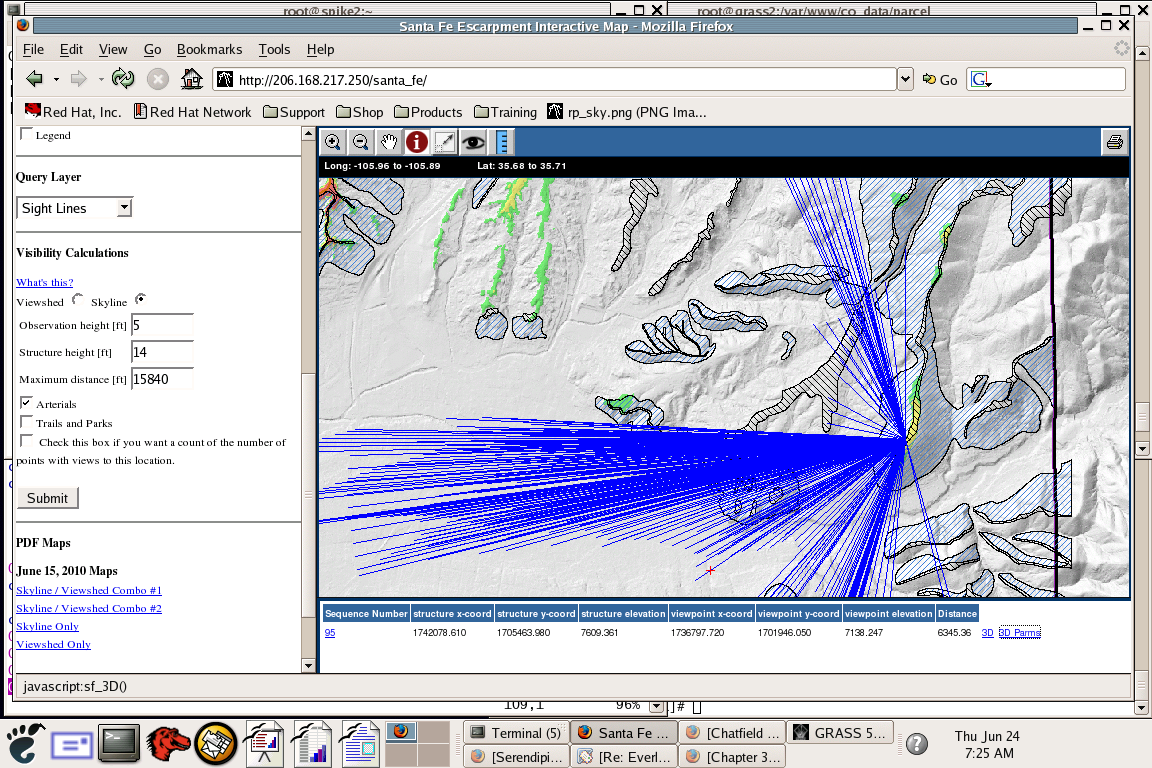
We can then choose any of the sight lines to generate a 3d rendering similar to the one at the top of this entry - all done in a server-side application with no plug-ins.
Tuesday, June 22. 2010
Fly The Plan!

Thursday, June 17. 2010
Staunton Master Plan
Fog at Staunton State Park
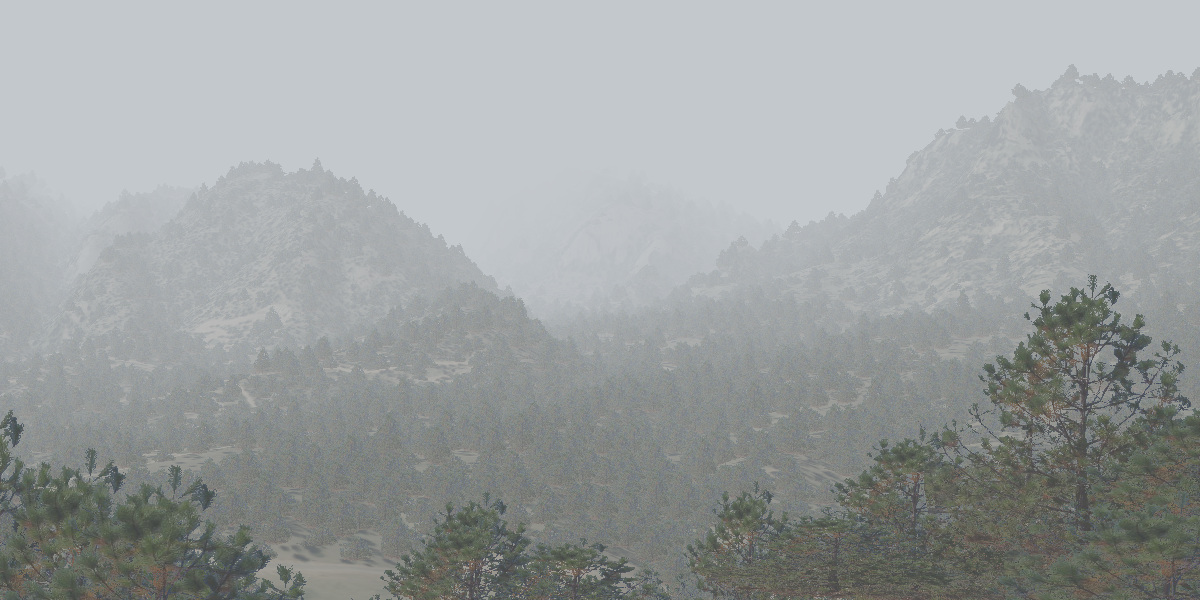
This image shows atmospheric attenuation and bitmapped trees (with random fluctuations in location, height and width.)
Santa Fe Sunrise
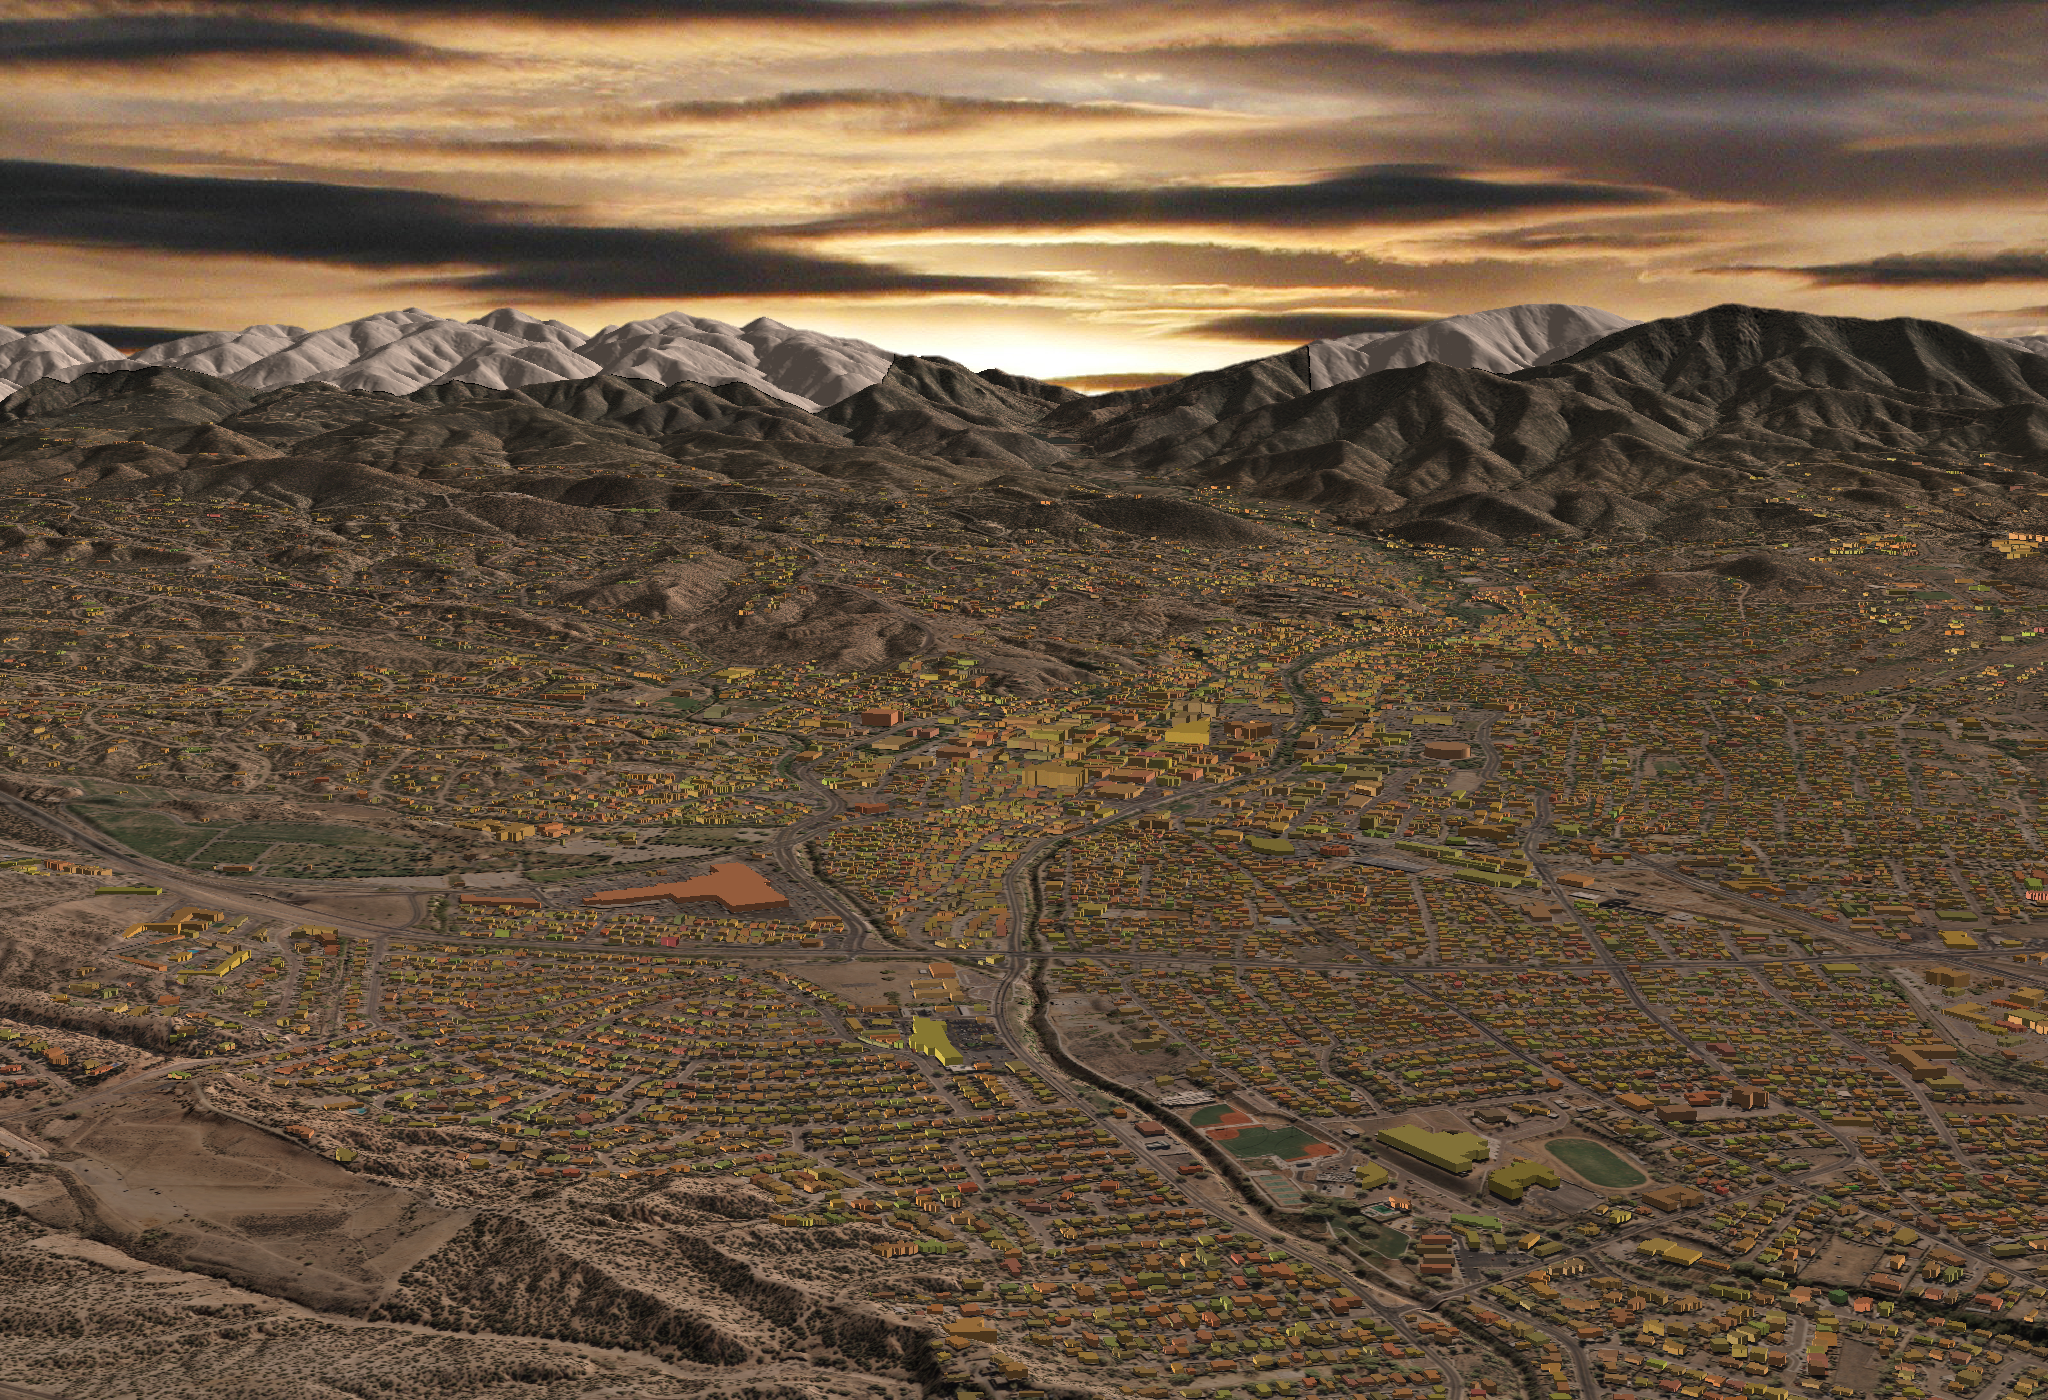
This "high over Santa Fe" image shows off a number of data layers from the City's GIS Department. The DEM was generated from LiDAR data; 6-in resolution orthophotos were used for the texture map; and digitized building footprints were extruded based on the building height field.Here's the full res image.